Class Progress Overview & Customization
Watch an overview of the Class Progress page
To access Class Progress, complete the following steps:
On the nav bar, click the Assessment menu, then select Class Progress.
Class Progress Overview
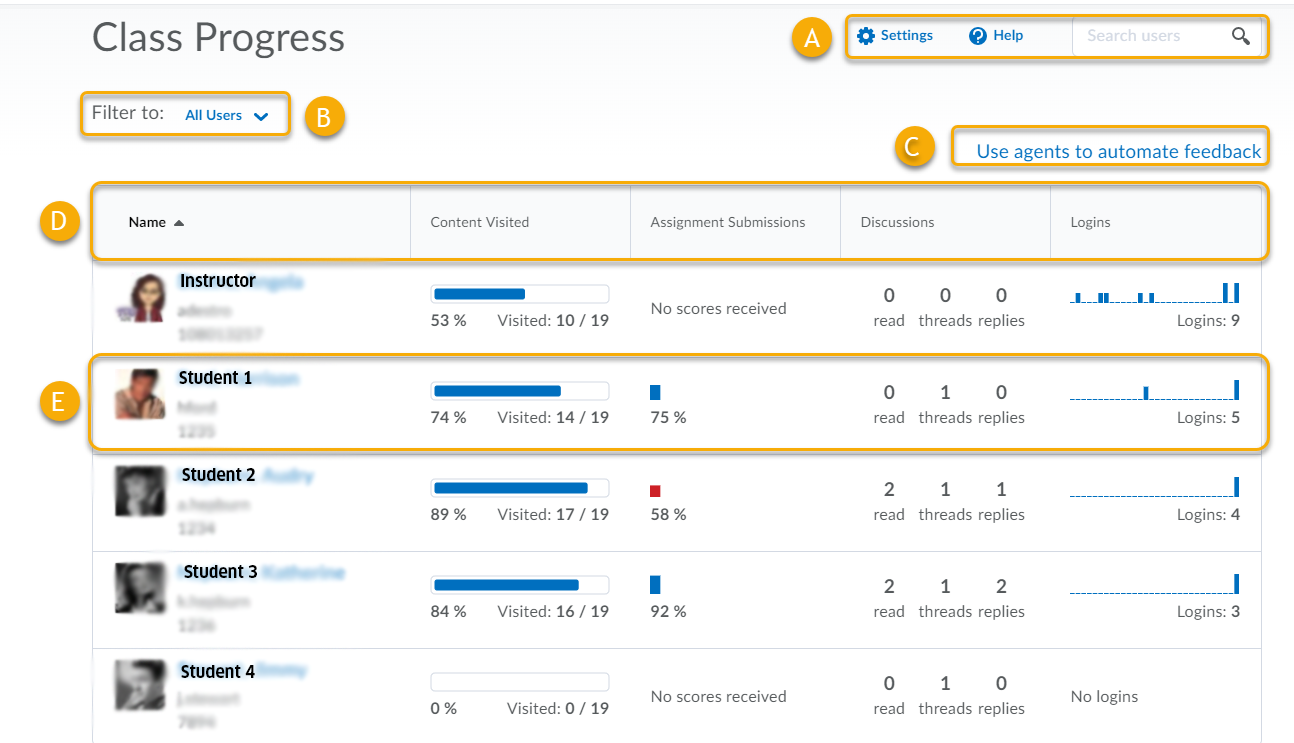
All course participants appear in the chart. Their name, username, and Org Defined ID (TCU ID number) display alongside their profile picture, if supplied. Their performance results for the listed indicators also display in the chart. Clicking on any area of this chart brings you to the individual user’s User Progress page.
- A. Settings, Help information, and User Search
- B. Filter Users – You can filter class participants based on membership in groups or sections.
- C. Intelligent Agents link “Use Agents to Automate Feedback.” Learn about Intelligent Agents.
- D. Sorting Filter – Use the Class Progress nav bar to sort the order in which users appear in the chart. By default, the following performance indicators appear from left to right in the nav bar: Content Visited, Assignments Performance Summary, Discussions Participation Summary, and Login History (Last 30 Days). A maximum of 4 performance indicators can display at any time on the Class Progress page. Available indicators include:
- Assignments Performance Summary
- Checklist Completion Summary
- Content Completion Summary
- Content Visited Summary
- Discussions Participation Summary
- Grades Performance Summary
- Login History (Last 30 Days) – Note: Login History indicates when the student logged into TCU Online, not the course. However, Course Logins displays in each student’s User Progress report, which reports on when they accessed the course. Absent period indicates the number of days since the student last logged into TCU Online. For example, if “Oct 30, 3017 – absent period: 3” displays, the student did not log in for 3 days, and an Oct 26 login displays below the Oct 30 login.
- Objectives Completion Summary
- Predicted Grade (for Student Success Users Only)
- Quiz Performance Summary
- Survey Completion Summary
- System Access (Last 30 Days) – Note: System Access indicates each time the student accesses TCU Online using a browser, or launches the Pulse app. System access begins when the user logs in, launches the app, or returns after 30 minutes of inactivity. It ends after 30 minutes of inactivity. Absent period indicates the number of days since the student last logged into TCU Online. For example, if “Oct 30, 3017 – absent period: 3” displays, the student did not log in for 3 days, and an Oct 26 login displays below the Oct 30 login.
- E. Students and Indicators – All course participants appear in the chart. Their name, username, and Org Defined ID (TCU ID number) display alongside their profile picture, if supplied. Their performance results for the listed indicators also display in the chart. Clicking on any area of this chart brings you to the individual user’s User Progress page.
Customize Class Progress: Change and Reorder Main Indicators
To customize Class Progress, complete the following steps:
- On the nav bar, click Assessment menu, then select Class Progress.
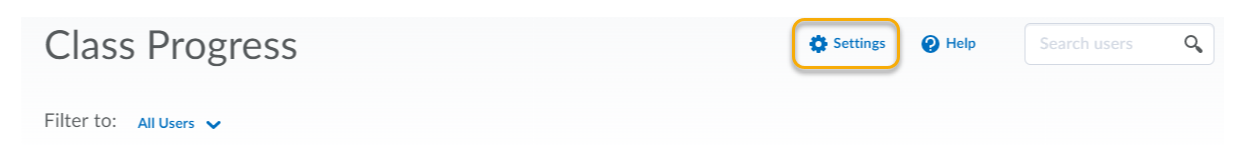
- Click on the Settings link in the upper right corner.
- Click on the context menu of the indicator that you do not want and select to Move Up, Move Down, or Replace.
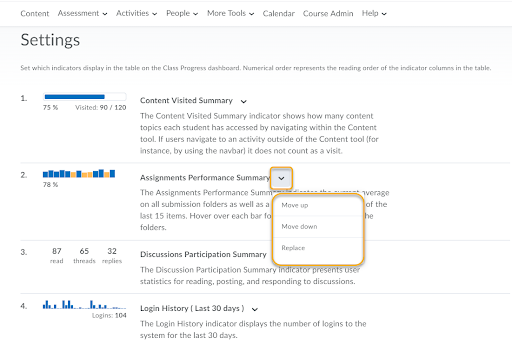
- If you selected Replace, select the new indicator you want displayed.
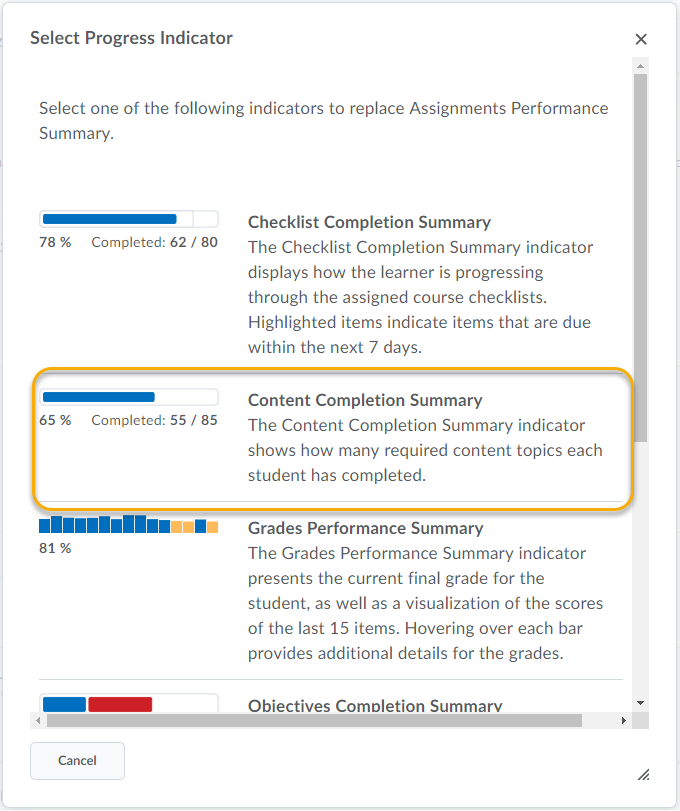
- Click Save and Close.