Course Overview Widget: Course Access
Course Access
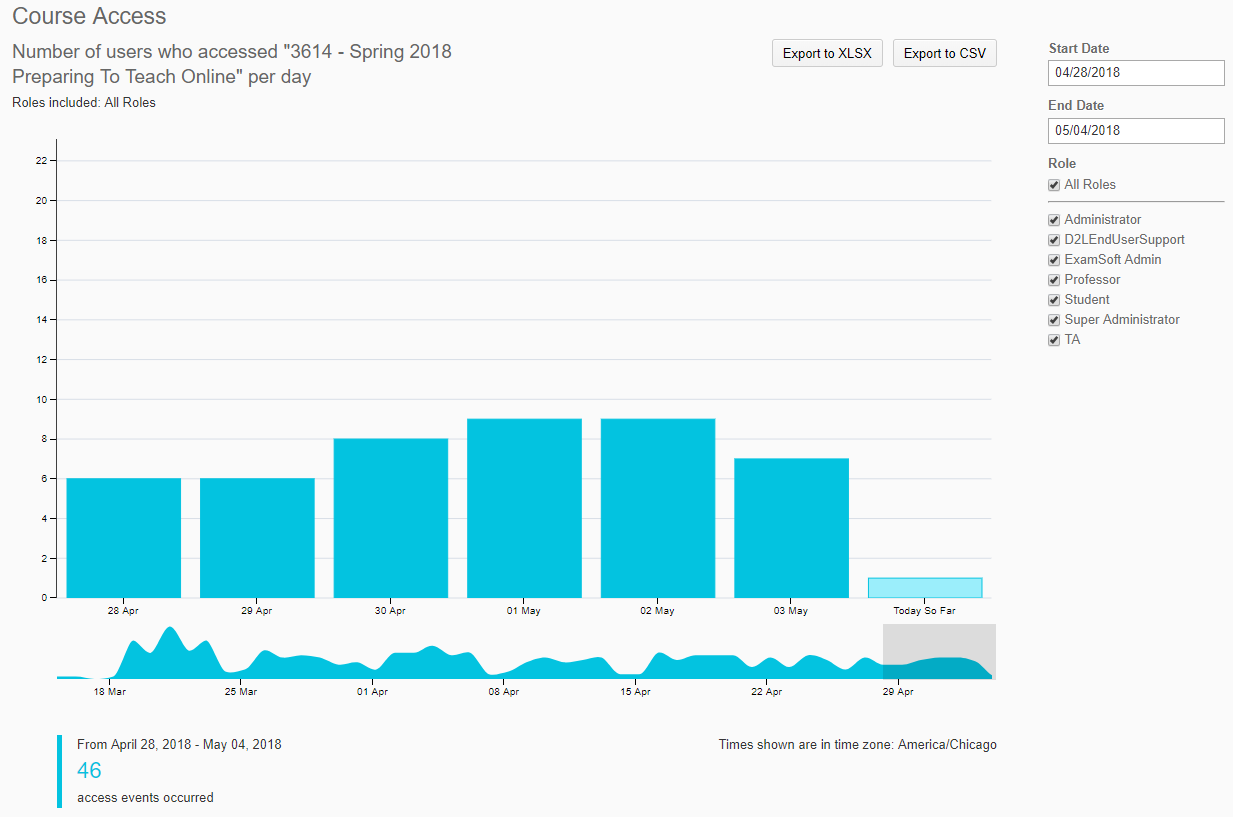
The Course Access report generates daily information on course “access events,” defined as a user visiting the course home page / landing page. This is a simple count metric. The data represents non-duplicated users per day who accessed the course.
The Course Access Report will display information on any user role and event in the course. By default, the Course Access report will populate automatically with a large bar graph showing course access for the last 7 days for all user roles, a line graph showing all-time course access for all user roles, and a table with the sum of the course access events during the range shown in the bar graph. Hovering over the columns in the bar graph will provide the exact number of course access events for a given date. The area highlighted in grey on the line graph is the date range shown in the bar graph and for the access events summary table. Course Access information can be used to identify periods of heavy and light course engagement, helping instructors identify trends and communicate with the students about their expectations for the course. Instructors might also use this information as they revise their courses, noting where student engagement might have trended downward and adding additional activities, resources, or communication for that module when the course is taught next.

Course Access report Filters
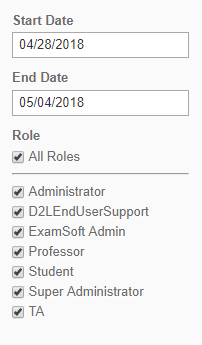
To filter the Course Access report, click and drag the grey box on the line graph below to select a date range that will then populate in the bar graph above. More filters can be found on the right side of page, if instructors with to filter a specific date range and filter by user role in the course.

To exit the Class Engagement report, click on the back button in the browser or on the course homepage (course title) link.