Course Overview Widget: Tool Access
Tool Access
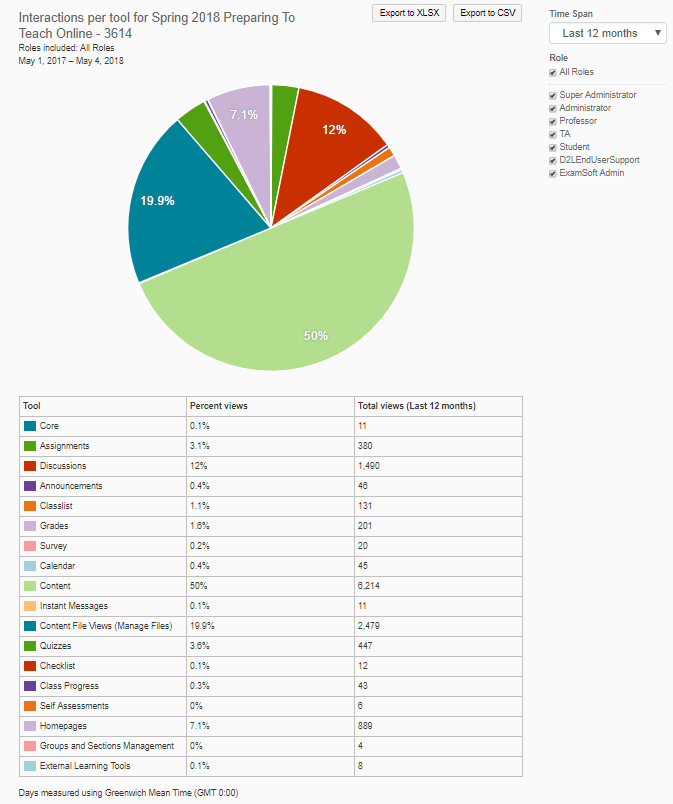
The Tool Access report provides information about how users are spending their time in the course. The pie chart shows the overall percentage of time that each tool is used. Hovering over different regions on the pie chart will provide exact information on the tool and number of view. The table below the pie chart separates the information by tool, showing the number of views and percentage of total views. The Tool Access report will default to the past 12 months and include all user roles. Tool Access reports can be used to monitor how users are spending their time in the course, whether the access profile for content and activities reflects the syllabus, and identify whether engagement with selected activities or course content meets expectations for the course.
Tool Access Report Filters
To filter the information on the Tool Access report, use the box on the right side of the page. Filters can be applied for set intervals of the last 7 days, 30 days, or 12 months. Filters can also be applied by user role in the course.
To exit the Class Engagement report, click on the back button in the browser or on the course homepage (course title) link.